Availability
Is the machine running when it is supposed to? This measures run time in relation to planned production time.
- Unplanned downtime due to faults and breakdowns
- Changeover and setup, e.g. format or product changes
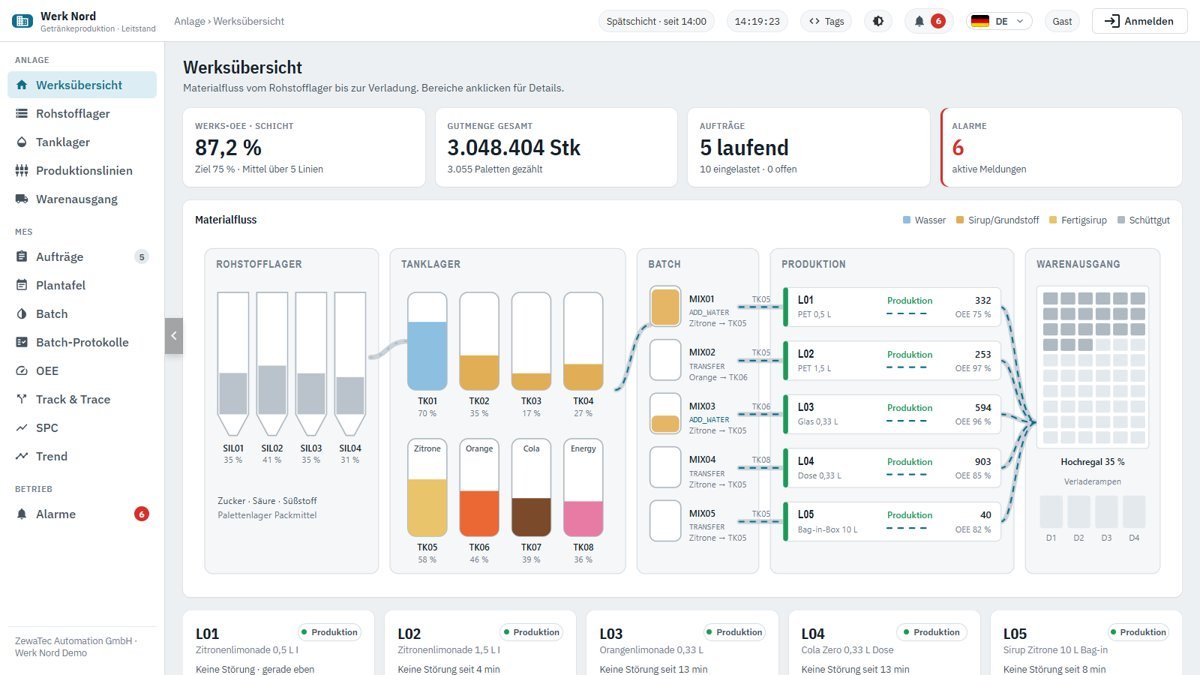
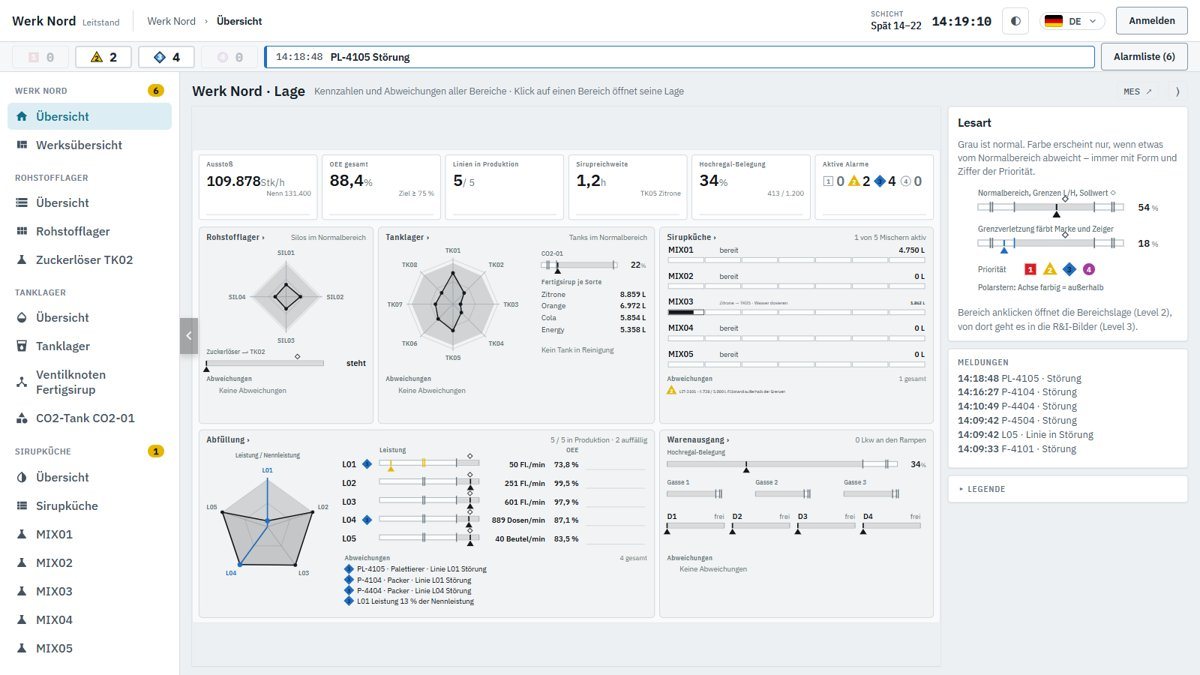 Try the Werk Nord control room live
Toolbox · OEE calculator
How much of your planned production time turns into good parts? Enter the figures for one shift. The calculator instantly shows availability, performance, quality and OEE – and where the time is lost.
The result appears as soon as all entries are valid.
OEE overall equipment effectiveness
–
Availability × performance × quality
Availability
–
Run time ÷ planned time
Performance
–
Ideal time ÷ run time
Quality
–
Good count ÷ total count
| Stage | Minutes | Share |
|---|
Your entries stay in your browser. Nothing is sent and nothing is stored – not even when you click “Discuss”.
What if …
Move a slider: the calculator shows how many additional good parts are produced – at the same rated speed and the same planned time.
Simplified calculation: each factor is capped at 100%. Whether a factor can be improved, and with how much effort, only becomes clear from an analysis of the loss reasons.
Context
OEE combines three types of loss in a single figure. A common breakdown is the “Six Big Losses” – six typical losses, two per factor.
Is the machine running when it is supposed to? This measures run time in relation to planned production time.
Is it running as fast as it could? This measures the ideal time for the quantity produced in relation to run time.
Is the result right first time? This measures the good count in relation to the quantity produced.
Compare OEE – only with the same definition. A value is only comparable with another if both are calculated the same way: do breaks and cleaning count as planned time? Is the rated speed the datasheet value or the best ever measured? Does a reworked part count as good? That is why we deliberately do not quote any “industry benchmarks” here. The most meaningful comparison is that of a line with itself over time.
Live demo · MES
Calculated by hand, OEE is a snapshot. In the MES, it is calculated continuously: downtime is recorded automatically and assigned a reason, and quantities come directly from the line. In Werk Nord, you can see this with the MES modules from Sepasoft – per line, per shift and per downtime reason.